
Economic Impact
Long-term growth trajectory in 2019 encounters 2020 headwinds
By OWP Staff
The economic contributions the wine industry makes to Oregon reflected robust growth from 2016 through 2019, according to the new report released in mid-February by the Oregon Wine Board. Conducted by Dr. Robert Eyler of Economic Forensics and Analytics, Inc., and Christian Miller, owner of Full Glass Research, this study is published every three years.
Preliminary numbers for 2019 reveal, once again, impressive growth made possible by grapegrowers and vintners, not to mention supply, sales and distribution chains in the state. More than 1,297 Oregon growers produced a crop valued at $237.8 million in 2019, an increase of 14%. This number crested the $200 million mark a mere two years ago, making wine grapes Oregon’s No. 1 fruit crop, according to Eyler and Miller.
In 2020, however, the pandemic, combined with tragic wildfires and government policy decisions, inflicted severe downward pressure on the industry’s momentum.
The following explains the four most revealing figures of growth:
1. The sum of all economic activity in Oregon related directly or indirectly to wine equaled $7.21 billion in 2019, compared to $5.67 billion three years prior, a 27% increase in statewide impact. This figure includes winery and grower revenues, wholesale and retail sales of wine, related industries such as trucking and professional services, plus wages throughout the supply chain and the effect of employees spending those wages in Oregon.
2. The estimated number of wine-related jobs in Oregon totaled 40,047 in 2019, up from just under 30,000 in 2016, a jump of 35%. In addition, wine continues to generate economic activity in every one of Oregon’s 36 counties.
3. Wine-related activity in 2019 contributed more than $184 million in state and local tax revenues; $88.5 million of that amount, or 48%, came from property tax revenues.
4. Augmented by growth of tourism to Oregon overall and rising spending from visitors, Dean Runyan Associates estimates overall tourism impacts in Oregon increased by $1.9 billion between 2016 and 2019, an estimated 17% rise. Through lodging, dining and other activities, wine-related tourism accounted for $894 million in statewide revenues, excluding sales from tasting rooms, a 13% increase over 2016 spending of $787 million.
A different story emerges for 2020. While wine-related wages topped $1.51 billion in 2019, up from $1.04 billion in 2016 and netting a 50% increase as the economy continued to recover from the Great Recession (2008–2010), researchers estimate the 2020 pandemic and natural calamities drove wages down to $1.16 billion in 2020. As a result of COVID-19, wildfires and other externalities, 2020 business revenue impacts are projected to be down 19.9%, contributing to declines of $1.48 billion, or 20.5%, in overall economic impact (revenue plus wages) compared to 2019.
Eyler states in the report: “The consolidated effects of COVID-19 and fires and smoke in 2020 reduced the industry’s economic impact by an estimated 20.5% from the 2019 estimates on Oregon’s economy.” But he adds a positive note to the executive summary with the growing reputation of Oregon wine: “With Nielsen retail data also reflecting that Oregon wines led all major regions in both volume and dollar growth in 2018 and 2019, the outlook for the Oregon wine industry remains positive, though 2020 has been a year of large challenges. COVID-19 dramatically curtailed in-bound tourist flow, and the impact of wildfire smoke on the 2020 wines is not yet fully understood.”
Miller, for whom this marks the fifth published Economic Impact Report for Oregon wine, sees value in Oregon retaining its high price per bottle, and the fact that demand, even during a tough financial year for most people, is still driving people to pay more for Oregon wine. “Many different data sources show Oregon maintaining the highest average price per bottle among wines from other states and even countries. This ability to command premium prices bodes well for the future of Oregon wine, as that is where growth continues in the wine market.”
The Oregon Wine Board and the state benefits from Miller’s 15-year perspective of Oregon’s wine industry. In fact, says OWB President Tom Danowski, “We are glad to sponsor this comprehensive report on the health and the performance of our state’s expanding wine industry as we look toward a gradual recovery. The ripple effects from our state’s wine economy on sustainable rural jobs, agritourism and local tax bases are increasingly important to our state. Christian Miller’s and Robert Eyler’s modeling expertise and experience with Oregon were especially critical this year as they worked to build a valid base of 2019 data off of which estimates related to the extraordinary circumstances of 2020 were possible.”
Wine grapes are Oregon’s most valuable fruit crop at $238 million, more than apples, cherries, cranberries, and hazelnuts combined. Pears rate a distant second at $109 million.
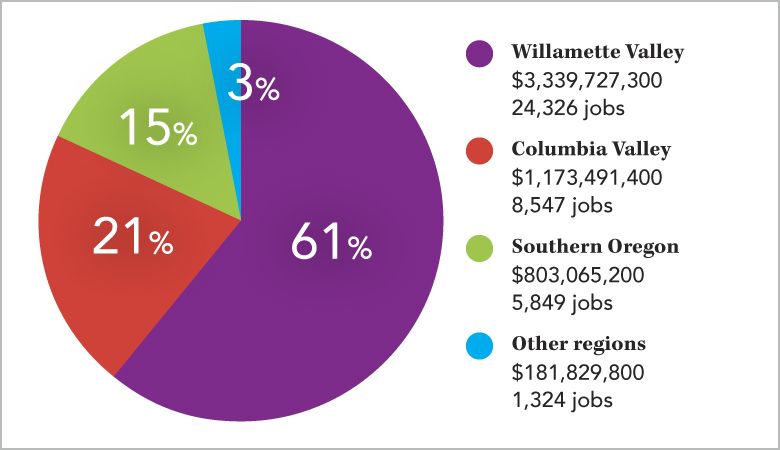
Charts below show the breakdown of all revenues, jobs and wages for each of four winegrowing regions, plus the top 10 wine-producing counties, ranked by wine-related revenue. Please go here for a brief summary and link to the report, and for the full report, please visit http://industry.oregonwine.org/wp-content/uploads/OR-Econ-Impact-2019-2020-FINAL.pdf.