Clash of Sensibilities


By Neal D. Hulkower
I am of two minds: oenophilic and mathematical. Since the former generally occupies the right side of my brain, while the latter the left, most the time the two stay out of each other’s way. When they do meet, the outcome can be reasonable, but trouble can result when passions collide. Such is the case when my inner oenophile is confronted with scores and ratings, which it knows are naïve gross over-simplifications, while the mathematician can’t resist anything quantified and adheres to the belief that when life gives you numbers, write an article. In the case of this piece, the mathematician initially prevailed. I couldn’t help myself.
First, let me start with the study that incited a response. Three members of the faculty of engineering at the University of Porto in Portugal, José Borges, António C. Real, and J. Sarsfield Cabral, and Southern Oregon University’s Gregory V. Jones published a paper in the Journal of Wine Economics last year entitled “A New Method to Obtain a Consensus Ranking of a Region’s Vintages’ Quality.” The following motivation for the study is given: “Understanding vintage quality variability and its influences are important in the economic sustainability of producers, consumer purchasing decisions, investor portfolio holdings and researchers examining the myriad drivers of quality. However, the process of finding an adequate measure of vintage quality is a challenging task due to the paucity of information and the inherent subjectivity in assessing quality.”
The authors assembled vintage charts “by internationally recognized critics, magazines, or organizations” from three wine regions: Piedmont, Burgundy and Champagne, and converted the numerical ratings, which are given on various scales (typically 5 or 100 points) to rankings. The individual rankings were aggregated to arrive at a consensus ranking for each region.
Since it has already been established that the Borda Count (see my article, “Borda is Better” on www.oregonwinepress.com) uniquely satisfies a few highly desirable properties while using all of the information in each ranking to arrive at the consensus, I took issue with their chosen method — advocated by and named for French mathematician Marie Jean Antoine Nicolas de Caritat, Marquis de Condorcet — used to combine the rankings.
Condorcet only considers pairwise contests between all the alternatives (in this case, vintages) and declares as winner the one that beats all others the most times. This obvious infraction of what should be regarded as “settled mathematics” became a case for the “Borda Patrol” and resulted in my publishing a comment on the paper in the next issue of the Journal of Wine Economics, which refutes the use of Condorcet and presents alternative consensus rankings based on Borda. In the same issue, the authors of the original paper offered a refutation which involves appealing to the fact that Condorcet satisfies a property that canonizes discarding part of voters’ preferences. My only response is that folks are entitled to their own opinions but not their own mathematics.
Rather than leaving an opening for the propagation of a flawed approach to aggregating the rankings, I set aside for the moment my objections to assigning numerical ratings to vintages and used Borda to prepare consensus rankings of Oregon Pinot Noir vintages based on several sources.
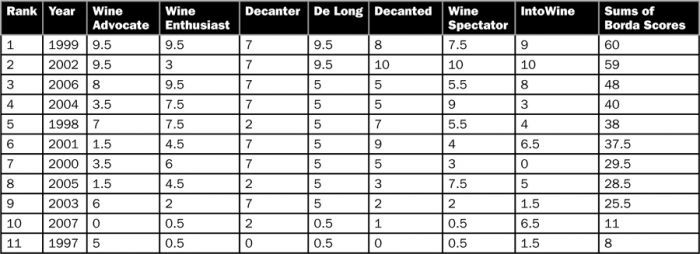
TABLE 1 is the consensus ranking of vintages 1997 to 2007 developed from seven charts prepared by Decanter, Decanted Wines, De Long, IntoWine, The Wine Advocate, Wine Enthusiast and Wine Spectator. The ratings given each vintage in each chart were converted to rankings, with ties permitted. Each ranking was converted to a Borda score as follows: The top ranked vintage received a score of 10 (one less than the number of vintages considered); the second, 9; and so on down to the bottom-ranked vintage, which received a score of 0. In the case of ties, each vintage received the average of the Borda scores assigned to the rankings the group occupies. So, for example, if three vintages out of 11 are tied and occupy the third through fifth positions, each would get a Borda score of (8 + 7 + 6) / 3 = 7. Note that ties are more common for Decanter and De Long since they use a scale of 5 to rate vintages. Borda scores for each of the seven sources, the sum of the scores and the consensus ranking are presented in Table 1. The higher the sum of the Borda scores, the higher the ranking. The consensus of the seven ranks 1999 at the top and 1997 at the bottom of the eleven vintages for which ratings from all were available.
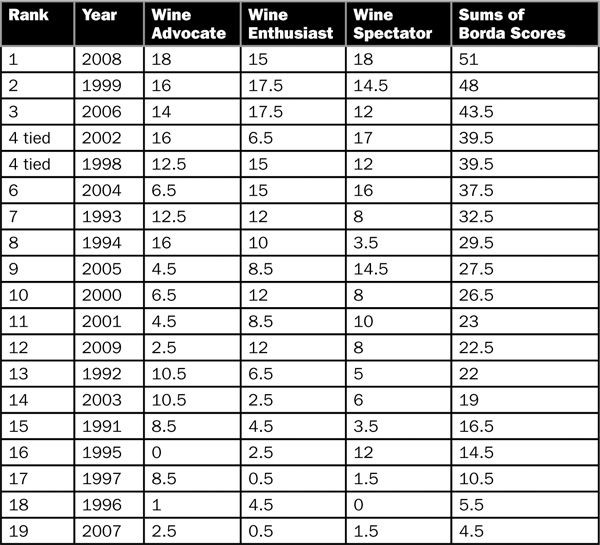
TABLE 2 considers only the ratings in the vintage charts from The Wine Advocate, Wine Enthusiast and Wine Spectator, compiling a consensus ranking for vintages 1991 to 2009. The process of applying Borda is the same, except we assign a score of 18 (one less than the 19 vintages considered) to the top ranked in each chart. Borda scores for each of the three sources, the sum of the scores and the consensus ranking are presented in Table 2. The 2008 vintage is at the top and 2007 at the bottom of the 19 vintages for which ratings from all three sources were available.
But my inner oenophile recoils at what the math hath wrought. Had not the Scott Paul Audrey and the Archery Summit Red Hills Pinot Noirs from the bottom-ranked 2007 vintage performed the “Dance of the Blessed Spirits” upon my palate and sent me to my sock drawer for replacements? On the other hand, were not many of the bottles from third ranked 2006 that I sampled overly zaftig, boozy, unbalanced and, sadly, inelegant?
What is going on, then? As with the selection of a method to aggregate the rankings, a critical factor in assessing the relative merits of vintage is the use of all information available. Distilling this information down to a single number omits too much and yields unsatisfactory results. As Allen Meadows, the Burghound, observes, “Like life, Burgundy vintages are simply far too complicated to be captured by a numerical rating on a chart.” Mrs. Burghound, Erica Meadows elaborates “[Allen] has said that most vintages vary too greatly because of Burgundy’s complex topography. Hail can easily hit one village and spare the one next to it, and as such, he believes vintage charts can actually do more harm than good. There are simply way too many variables that come into play, not the least of which are the extremely localized weather effects, individual terroir and quality of the growers themselves. He feels vintage charts can do more to mislead consumers than inform them and that buying on the basis of vintage is dangerous because one producer may have done spectacularly well, either by luck or skill, even in a poor vintage, whereas someone less diligent, or less lucky, may have performed poorly in a great vintage.”
Such is the case with Oregon vintages, I might add. Therefore, while the mathematician did the best he could with what he had, but over which he had no control, the outcomes are ultimately unsatisfying and reflect the oversimplification inherent in each of the constituent charts.
So what is a consumer or investor or any one of the supposed beneficiaries of these aggregated rankings to do? Believe no one but yourself. Trust your own palate and no one else’s unless you have calibrated yours to theirs. If you are a researcher seeking the determinants of quality, you would be well advised to take consensus rankings with a grain of salt, as well. Better to read a range of reviews of a representative but sufficiently broad range of samples from the vintages of interest and to seek other metrics, such as total degree days, rainfall and length of growing season, as more valuable representations of a particular year. That might give the mathematician something a little more credible to work with.


